
Our free AP Environmental Science Unit 3 practice test covers populations. Studying populations allows students to understand the balance between the living world and the resources available for organisms to use. You will learn about different types of population growth dynamics and how one population can affect the growth of another. Long term trends will also be evaluated.
Congratulations - you have completed .
You scored %%SCORE%% out of %%TOTAL%%.
Your performance has been rated as %%RATING%%
Your answers are highlighted below.
Question 1 |
Which of the following factors does NOT affect species richness?
Latitude | |
Survivorship curves | |
Time | |
Habitat size |
Question 1 Explanation:
The correct answer is (B). The species richness of a community is influenced by latitude, time, habitat size, and distance from other communities. Survivorship curves are NOT a factor that affects species richness. Survivorship curves are graphs that represent the proportion of surviving individuals as the cohort ages.
Question 2 |
In an experiment, two groups of paramecium species are grown together in a contained environment. P. aurelia grew well after 18 days, while P.caudatum declined to extinction over 18 days. This result demonstrates which of the following?
Competition | |
Predation | |
Competitive exclusion principle | |
Resource partitioning |
Question 2 Explanation:
The correct answer is (C). The competitive exclusion principle states two species competing for the same limiting resource(s) cannot coexist. One of two species sharing identical, or nearly identical, niches, will be driven to, local, extinction.
Question 3 |
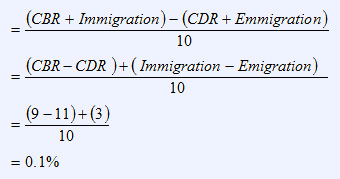
A country has a Net Immigration Rate of 3 per 1,000; a Crude Birth Rate (CBR) of 9 per 1,000; and a Crude Death Rate (CDR) of 11 per 1,000. What is the growth rate of this country?
0.1% | |
0.2% | |
0.5% | |
1% |
Question 3 Explanation:
The correct answer is (A). According to the question, CBR = 9 per 1000; CDR = 11 per 1000; and Net immigration (which is equivalent to Immigration minus Emigration) at a rate of 3 per 1000.
The national population growth rate is determined by calculating the difference between the factors contributing to population increase (CBR and immigration) and the factors contributing to population decrease (CDR and emigration), all divided by 10. Use the equation for National Population Growth:
The national population growth rate is determined by calculating the difference between the factors contributing to population increase (CBR and immigration) and the factors contributing to population decrease (CDR and emigration), all divided by 10. Use the equation for National Population Growth:
Question 4 |
Which of the following describes the shape of the logistic growth model with time as the independent variable and population growth as the dependent variable?
Parabolic-shaped curve | |
J-shaped curve | |
S-shaped curve | |
Straight line |
Question 4 Explanation:
The correct answer is (C). The logistic growth model produces an S-shaped curve when graphed. This model illustrates a population that initially grows exponentially (curves sharply upward), slows (curves slowly to the right) as the population approaches the carrying capacity of the environment and then levels off at carrying capacity.
Question 5 |
Which of the following is an r-adapted species?
Elephants | |
Mice | |
Gorillas | |
Wolves |
Question 5 Explanation:
The correct answer is (B). R-adapted species have adapted for high rates of growth; they are usually smaller in size, require little energy, produce many offspring, exhibit an early maturity and a short life span, and most individuals die within a short period of time, but some individuals live for an extended period of time. K-adapted species have slower growth, are usually much larger, live longer lives, and have adapted to live at or near carrying capacity. Of the choices, mice most closely match the r-adapted species description.
Question 6 |
Which of the following population descriptions portrays the number of individuals in a particular age category?
Population size | |
Population density | |
Population distribution | |
Population age structure |
Question 6 Explanation:
The correct answer is (D). Within a population, there are individuals of varying ages. When population ecologists describe the number of individuals fitting into a particular age category, they are looking at population age structure. This data helps ecologists understand how quickly a population can grow.
Question 7 |
Questions 7-9 refer the following graphs:
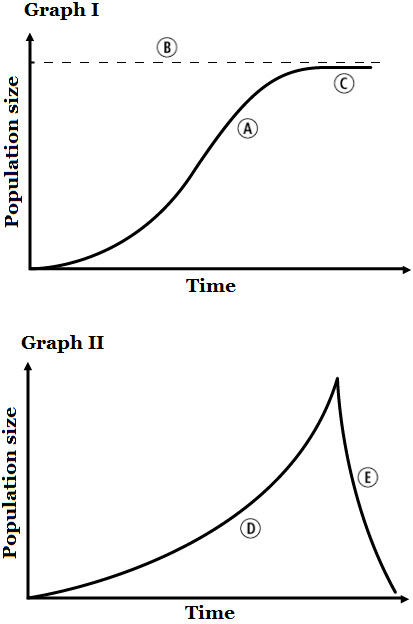
Which example fits the growth pattern shown in Graph II?
A population of 10 rabbits is introduced into an area with good supply of food that regenerates easily. | |
A population of 4 coyotes is reintroduced into an area that previous sustained a population of several hundred coyotes before they were hunted to local extinction. | |
A population of reindeer was introduced to an island with no predators and a limited food supply. After the food was consumed, there was a dramatic drop in the population size. | |
A population of harbor seals was actively hunted in Washington State in the early 20th century under a government program that viewed them as harmful predators. This greatly reduced their numbers. Since the program was discontinued, the seal population has rebounded in a logistic pattern. |
Question 7 Explanation:
The correct answer is (C). Graph II shows a growing population with a sudden drop, indicating that the population grew exponentially and then had a dramatic population decline. This can be caused by the organism running out of food, causing mass starvation and death. Thus, the reindeer example is the best choice.
Question 8 |
Which letter on the graphs represents a population’s carrying capacity?
A | |
B | |
C | |
D |
Question 8 Explanation:
The correct answer is (B). When a population reaches carrying capacity, the population stops growing and becomes stable.
Question 9 |
Which letter on the graph represents exponential growth?
A | |
B | |
C | |
D |
Question 9 Explanation:
The correct answer is (D). Exponential growth curves appear as a “J” shaped curve on a graph.
Question 10 |
The average number of offspring required to offset the average number of deaths in a population so that the population remains stable is referred to as:
Crude birth rate | |
Crude death rate | |
Replacement level fertility | |
Total fertility rate |
Question 10 Explanation:
The correct answer is (C). Demographers calculate replacement level fertility to determine changes in population size. Replacement level fertility looks at the average number of offspring needed to offset the average number of deaths in a population. Typically, for a population of humans, this requires a bit over 2 offspring per woman.
Question 11 |
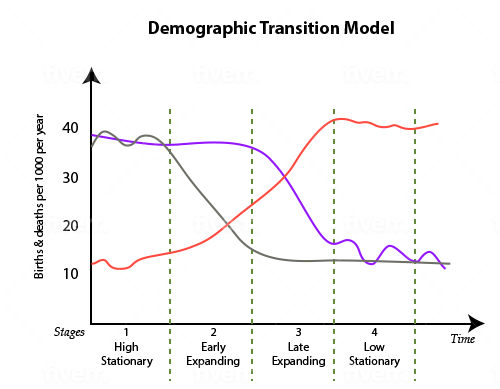
Use the graph to answer question 11:
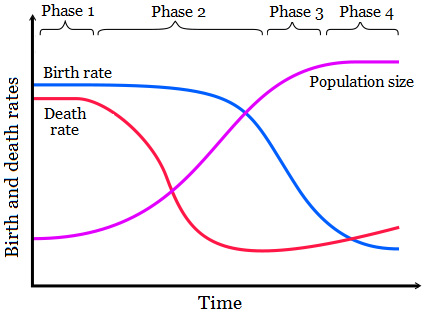
During which phase(s) of the demographic transition does the death rate decline while the birth rate remains high, and the population grows rapidly?
Phase 1 | |
Phase 2 | |
Phase 3 | |
Phase 4 |
Question 11 Explanation:
The correct answer is (B). In the graph, both the birth rate line and the death rate line are declining in Phase 2. Also in Phase 2, the population size line is increasing.
Question 12 |
Use the age structure diagram to answer question 12:
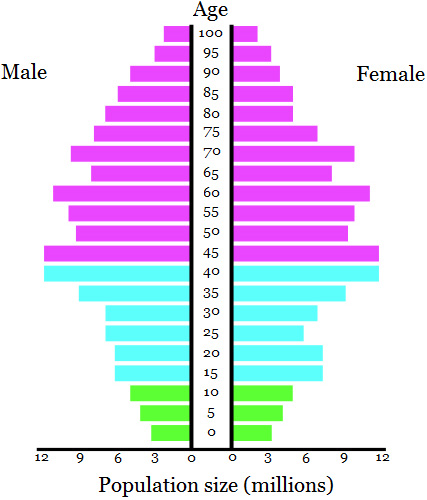
A country with an age structure like the one shown above will experience:
A rapidly growing population | |
Stable population growth | |
A decline in population | |
High life expectancy |
Question 12 Explanation:
The correct answer is (C). A country with an age structure diagram like the one above will experience a decline in the population because there less children than adults. Therefore, when the children reach childbearing age, it is unlikely they will collectively produce enough offspring to offset their elderly, dying parents.
Question 13 |
Which of the following illustrates a global impact related to population growth?
Traffic into cities creates traffic jams and increases travel time into and out of developments | |
The conversion of forested areas into agricultural land reduces the uptake of carbon dioxide by plants | |
Converting land into agricultural land can cause erosion | |
The building of new developments decreases habitat for local wildlife |
Question 13 Explanation:
The correct answer is (B). Conversion of forested areas into agricultural land reduces the uptake of carbon dioxide by plants, thereby not removing carbon dioxide from the atmosphere and contributing to global warming.
Question 14 |
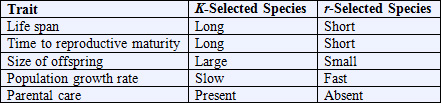
Which line on the chart CORRECTLY matches the traits for K-selected and r-selected species?
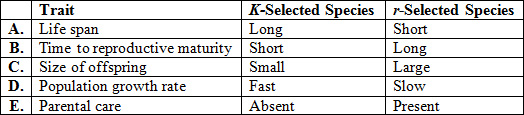
A | |
B | |
C | |
D |
Question 14 Explanation:
The correct answer is (A). The following chart represents the correct traits of K-selected and r-selected species.
Question 15 |
Racoons are found in urban, suburban, rural, and wild settings. Because they can make use of a wide range of habitats and resources they are considered:
Producers | |
Omnivores | |
Keystone species | |
generalists |
Question 15 Explanation:
The correct answer is (D). Generalists can survive in a wide range of ecosystems and survive on a large variety of food sources.
Question 16 |
A factor that influences an individual's ability to survive and reproduce based on the size of a population in a given area is a:
Carrying capacity | |
Limiting resource | |
Density-independent factor | |
Density-dependent factor |
Question 16 Explanation:
The correct answer is (C). Density-independent factors include things such as disease where a larger population makes it easier for the disease to spread from one member to the next.
Question 17 |
A country with a high birth rate and a high death rate where many children are born but few people make it to middle and old age has an age structure diagram that looks like what?
a Tapered Column | |
a column | |
an inverted pyramid | |
a pyramid
|
Question 17 Explanation:
The correct answer is (D). An age structure diagram displays the relative percent of a population at each age category. In a country with a high birth rate and a high death rate the base of the pyramid, reflecting youth, would be widest with a steep rise to the top of the pyramid as more people die at a young age due to lack of health care and poor living conditions.
Question 18 |
According to the theory of demographic transition a population in phase four would show which type of population growth?
declining population growth | |
stable population growth | |
rapid population growth | |
slow population growth |
Question 18 Explanation:
The correct answer is (A). A country in phase four of the demographic transition model would likely show a slowly declining rate of population growth and more affluent populations tend to have more women going to college and entering the workforce.
Question 19 |
Type I survivorship curves show the number of survivors remains stable early, but eventually decreases sharply at a particular upper age limit. Type II survivorship curves show the number of survivors steadily decreases with an increase in age.
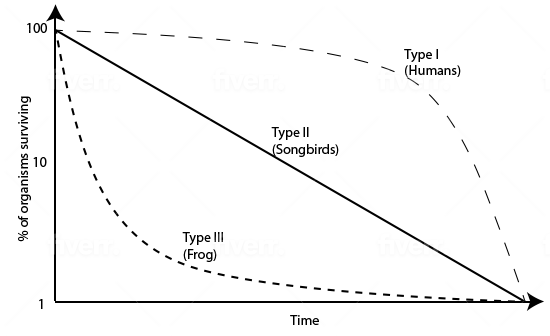
Which of the following can you determine from the descriptions of survivorship curves provided above?
Type II could be an r-selected species with few surviving offspring. | |
Type II could be a k-selected species with few offspring that each have a high chance of survival. | |
Type I could represent a prey animal with few offspring surviving to adulthood. | |
Type II could represent a species that is in the middle of the k to r selection spectrum such as a rabbit. |
Question 19 Explanation:
The correct answer is (D). In a Type II survivorship curve species typically have a middle-sized number of offspring that receive some parental care and thus have an increased chance of surviving to adulthood, but some factor, such as predation, leads to a steady decline in survivorship.
Question 20 |
Which of the following explains factors that lead to a declining birth rate in countries transitioning from phase two to phase three in demographic transition:
I. More women tend to stay home as a country becomes more developed leading to decreased birth rates
II. More women tend to earn advanced degrees in developed nations so they enter the workforce and have less time to raise children.
III. There are more opportunities to own businesses in developed nations
I is correct | |
I and III are correct | |
I and II are correct | |
II and III are correct |
Question 20 Explanation:
The correct answer is (D). Developing nations tend to recognize the economic potential of women and their equality with men. As more women attain higher education and start their businesses less time is devoted to having children.
Once you are finished, click the button below. Any items you have not completed will be marked incorrect.
There are 20 questions to complete.
|
List |
Next Practice Test:
Unit 4: Earth Systems >>
AP Environmental Science Main Menu >>